speedscope
last updated: Oct 20, 2023
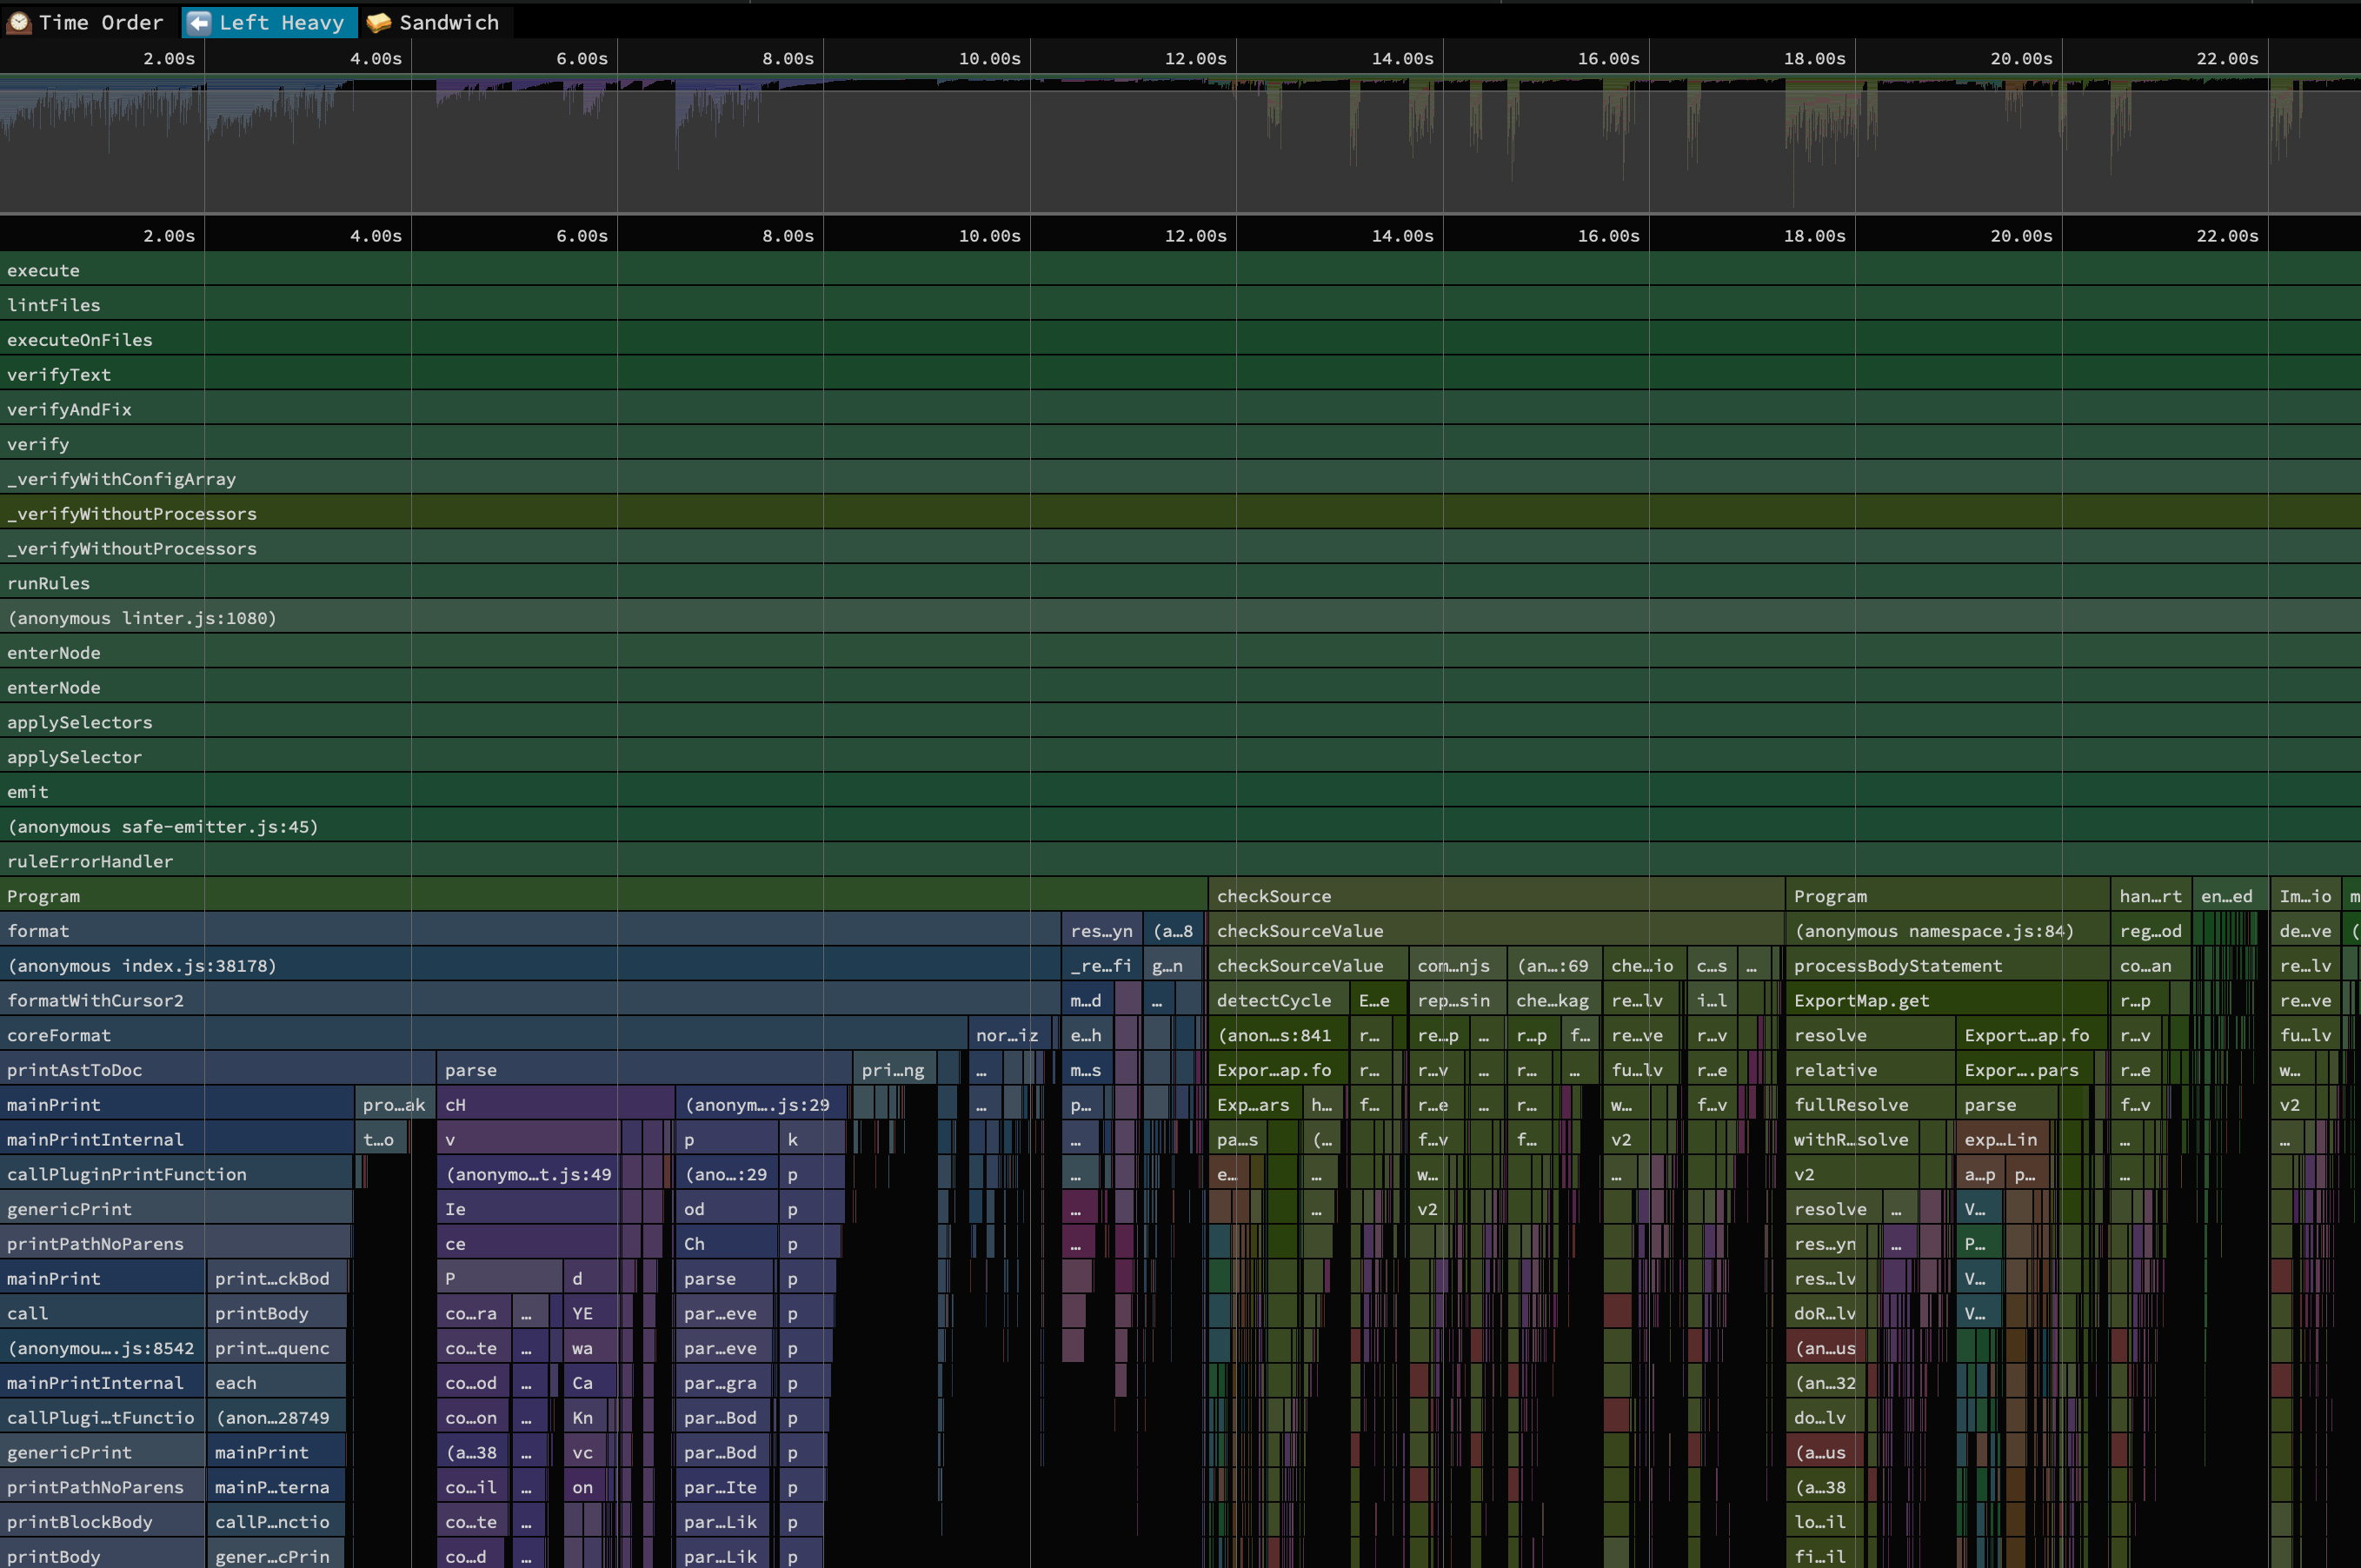
speeding up javascript one library at a time shows how you can use this tool to generate flamegraphs that represent total time instead of exactly when the calls occurred.
It works by dropping a .cpuprofile file on it. Then at the top, select "⬅️ Left Heavy" to switch to a profile-by-call view instead of a profile-by-time.
I generated a profile of my eslint run by calling it like so: node --cpu-prof node_modules/.bin/eslint --ext js,jsx,ts,tsx ., that generated a file CPU.20230601.151131.57473.0.001.cpuprofile which I dropped on the profiler. Impressive stuff.