Gridviz
last updated: Dec 25, 2025
https://github.com/eurostat/gridviz
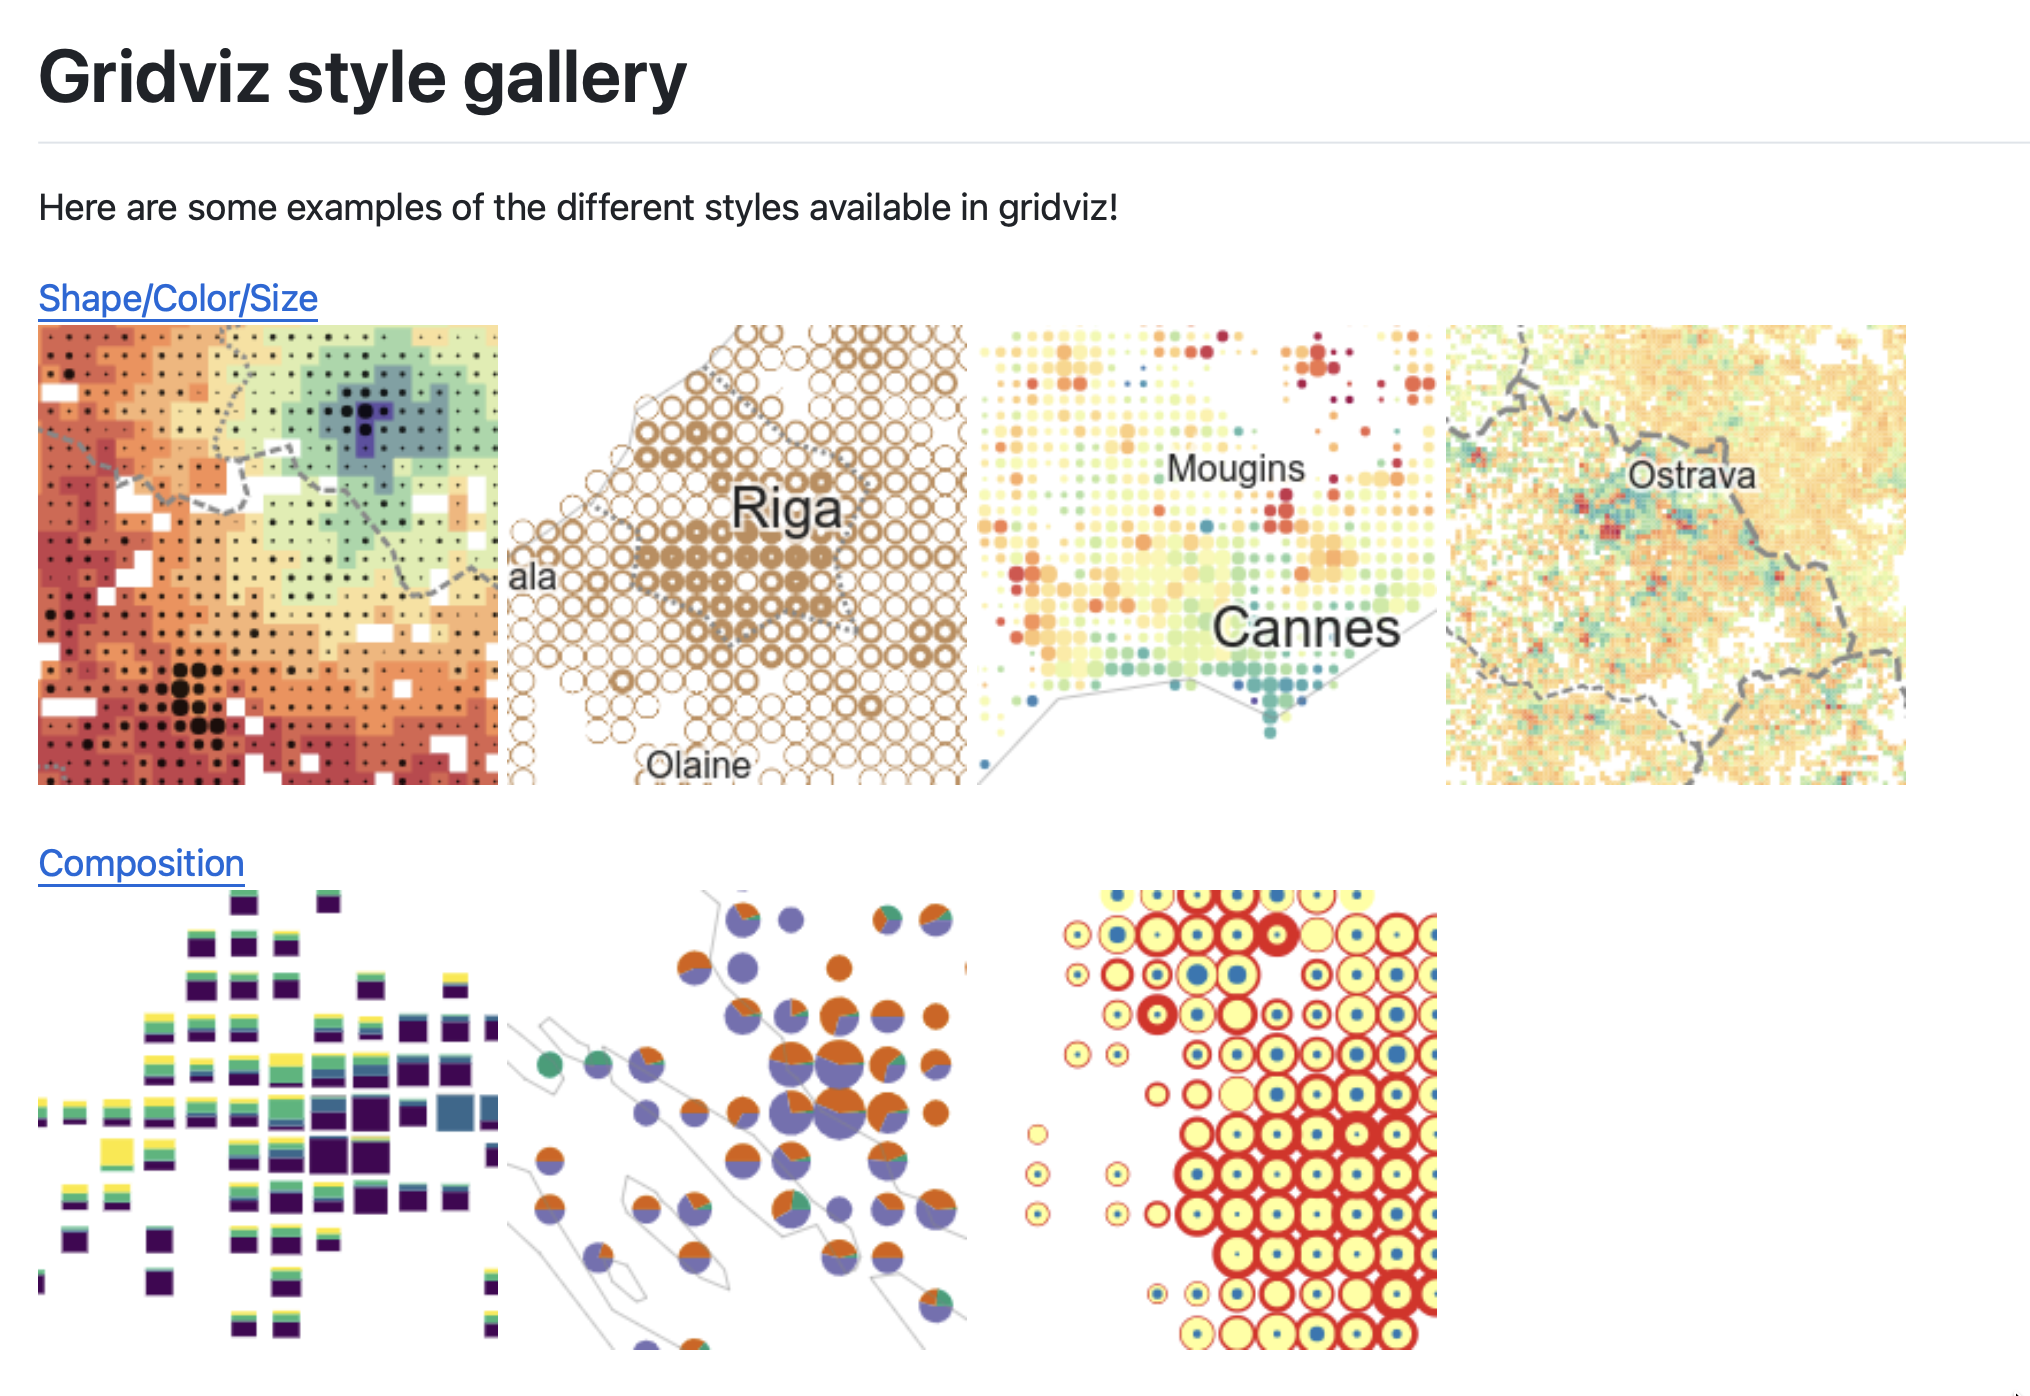
Gridviz is a JavaScript library for visualizing gridded data (or any tabular dataset with x/y coordinates for that matter) in the browser using a large variety of cartographic styles and techniques. Unlike traditional raster-based web mapping tools, Gridviz renders everything client-side, on the fly.
I have a vague idea to play with this to make geographical-looking NBA stats visualization