ggsql
last updated: Jul 07, 2026
ggsql brings the elegance of the Grammar of Graphics to SQL. Write familiar queries, add visualization clauses, and see your data transform into beautiful, composable charts — no context switching, no separate tools, just SQL with superpowers.
ggsql introduces the VISUALIZE keyword into its sql dialect, allowing you to do grammar of graphics charts from SQL queries. The home page has an example:
-- Regular query
SELECT * FROM ggsql:penguins
WHERE island = 'Biscoe'
-- Followed by visualization declaration
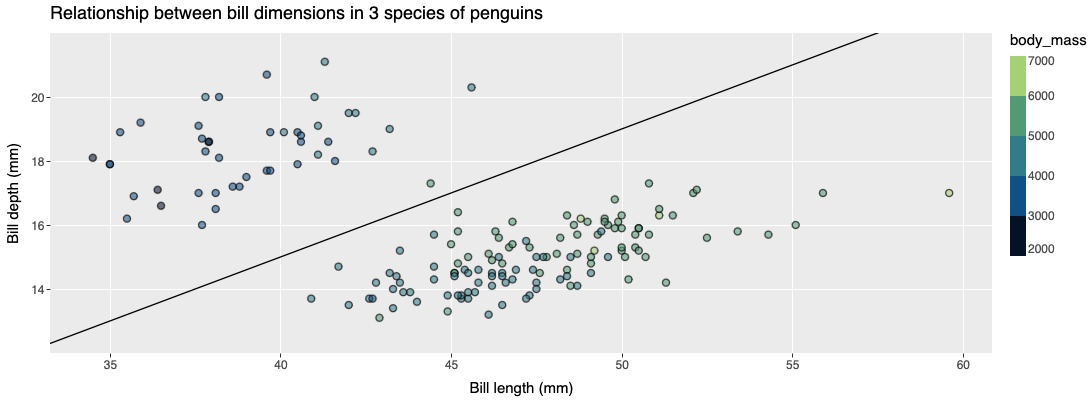
VISUALISE bill_len AS x, bill_dep AS y, body_mass AS fill
DRAW point
PLACE rule
SETTING slope => 0.4, y => -1
SCALE BINNED fill
LABEL
title => 'Relationship between bill dimensions in 3 species of penguins',
x => 'Bill length (mm)',
y => 'Bill depth (mm)'
There's an introductory blog post here: https://opensource.posit.co/blog/2026-04-20_ggsql_alpha_release/ with some more motivations and introductory text
Uses vega-lite specs for generating graphics
Backlinks