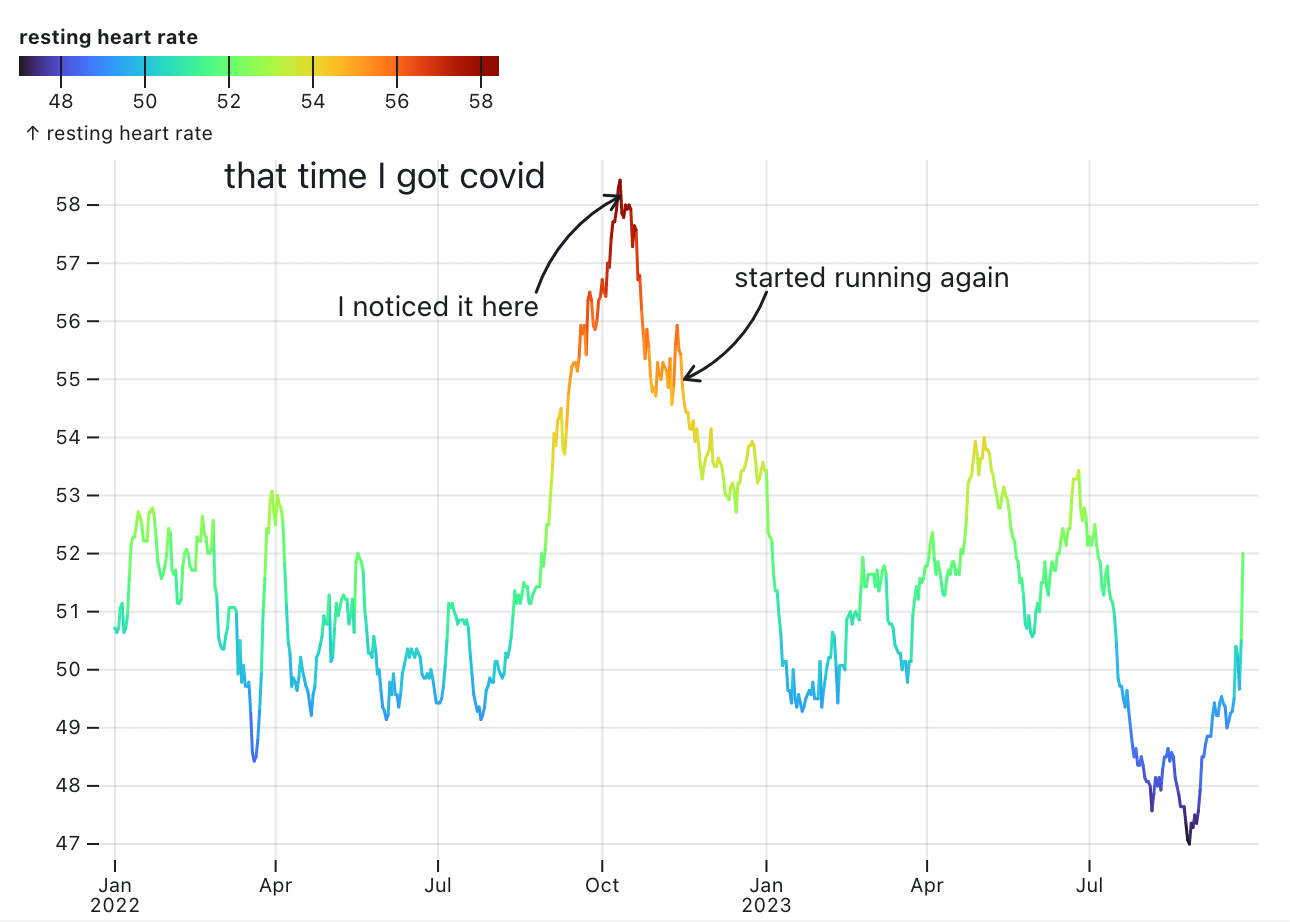
how to color a line by a sliding window
Mar 02, 2024
In this thread, @fil explains to me how to use a null z channel to indicate to observable plot that the line in this notebook ought to be colored by its position on the y axis.
I actually hit the same issue I'd hit 6 months later with what arguments go where in plot.window, though it was only part of the solution.
Plot.plot({
  inset: 8,
  grid: true,
  color: {
    legend: true,
    label: "resting heart rate"
  },
  y: {
    label: "resting heart rate"
  },
  marks: [
    Plot.line(
      hr.filter((d) => d.date >= new Date("2022-01-01")),
      // I don't have any idea what z: null means, @fil helped me figure this part out
      // https://talk.observablehq.com/t/how-to-stroke-a-line-with-a-sliding-window/8312
      Plot.map(
        {
          y: Plot.window({ k: 14, anchor: "end" }),
          stroke: Plot.window({ k: 14, anchor: "end" })
        },
        { x: "date", y: "heartRate", stroke: "heartRate", z: null, tip: true }
      )
    ),
    Plot.text(["that time I got covid"], {
      x: new Date("2022-06-01"),
      y: 58.5,
      textAnchor: "middle",
      fontSize: 18
    }),
    Plot.text(["I noticed it here"], {
      x: new Date("2022-07-01"),
      y: 56.25,
      textAnchor: "middle",
      fontSize: 14
    }),
    Plot.arrow([12], {
      x1: new Date("2022-08-25"),
      y1: 56.5,
      x2: new Date("2022-10-11"),
      y2: 58.15,
      bend: true
    }),
    Plot.text(["started running again"], {
      x: new Date("2023-03-01"),
      y: 56.75,
      textAnchor: "middle",
      fontSize: 14
    }),
    Plot.arrow([12], {
      x1: new Date("2023-01-01"),
      y1: 56.5,
      x2: new Date("2022-11-16"),
      y2: 55,
      bend: true
    })
  ]
})