How Humans see data
Nov 20, 2023
Lovely talk by John Rauser at Velocity Conference:
https://www.youtube.com/watch?v=fSgEeI2Xpdc
- Bill Cleveland's The Elements of Graphing Data
- three visual operations of pattern perception
- detection
- assembly
- estimation
- three tasks we try to complete with a graph, in order of difficulty:
- discrimination (tell one from another)
- ranking (is x > y?)
- ratioing (x is about 3 times bigger than y)
- the best charts let you do all three
- three visual operations of pattern perception
- "efficient comparison between data sets is almost always the purpose of visualizing data"
- "this table might be the single most important thing that you can know about visualizing data:
Ordering elementary tasks by accuracy, according to theoretical arguments and experimental results. Graphs should exploit tasks as high in the ordering as possible. The tasks are ordered from most accurate to least:
- Position along a common scale
- Position on identical but nonaligned scales
- Length
- Angle
- Slope (with ϴ not too close to 0, pi/2 or pi radians)
- Area
- Volume
- Density
- Color Saturation
- Color Hue
- note: in the original table, Angle and Slope are show as equally accurate, as are Volume, Density, and Color Saturation
- The default order for a categorical variable (often alphabetical) is almost never appropriate: consider the order intentionally
- stacking anything is nearly always a mistake
- almost always you'd do better with two charts that are each accurate
- stacking makes the reader decode lengths, which is less precise than position on a common scale
- pie charts
- the reason we all know that pie charts are bad is that they encode data as an angle
- they encode so few numbers that a table is better
- comparison is trivial on a common scale

- Question: did the spike occur at the same time in each chart?
- answer: no, but it's not easy to tell, you have to look back and forth and remember a value
- We can do better by putting them on a common scale:
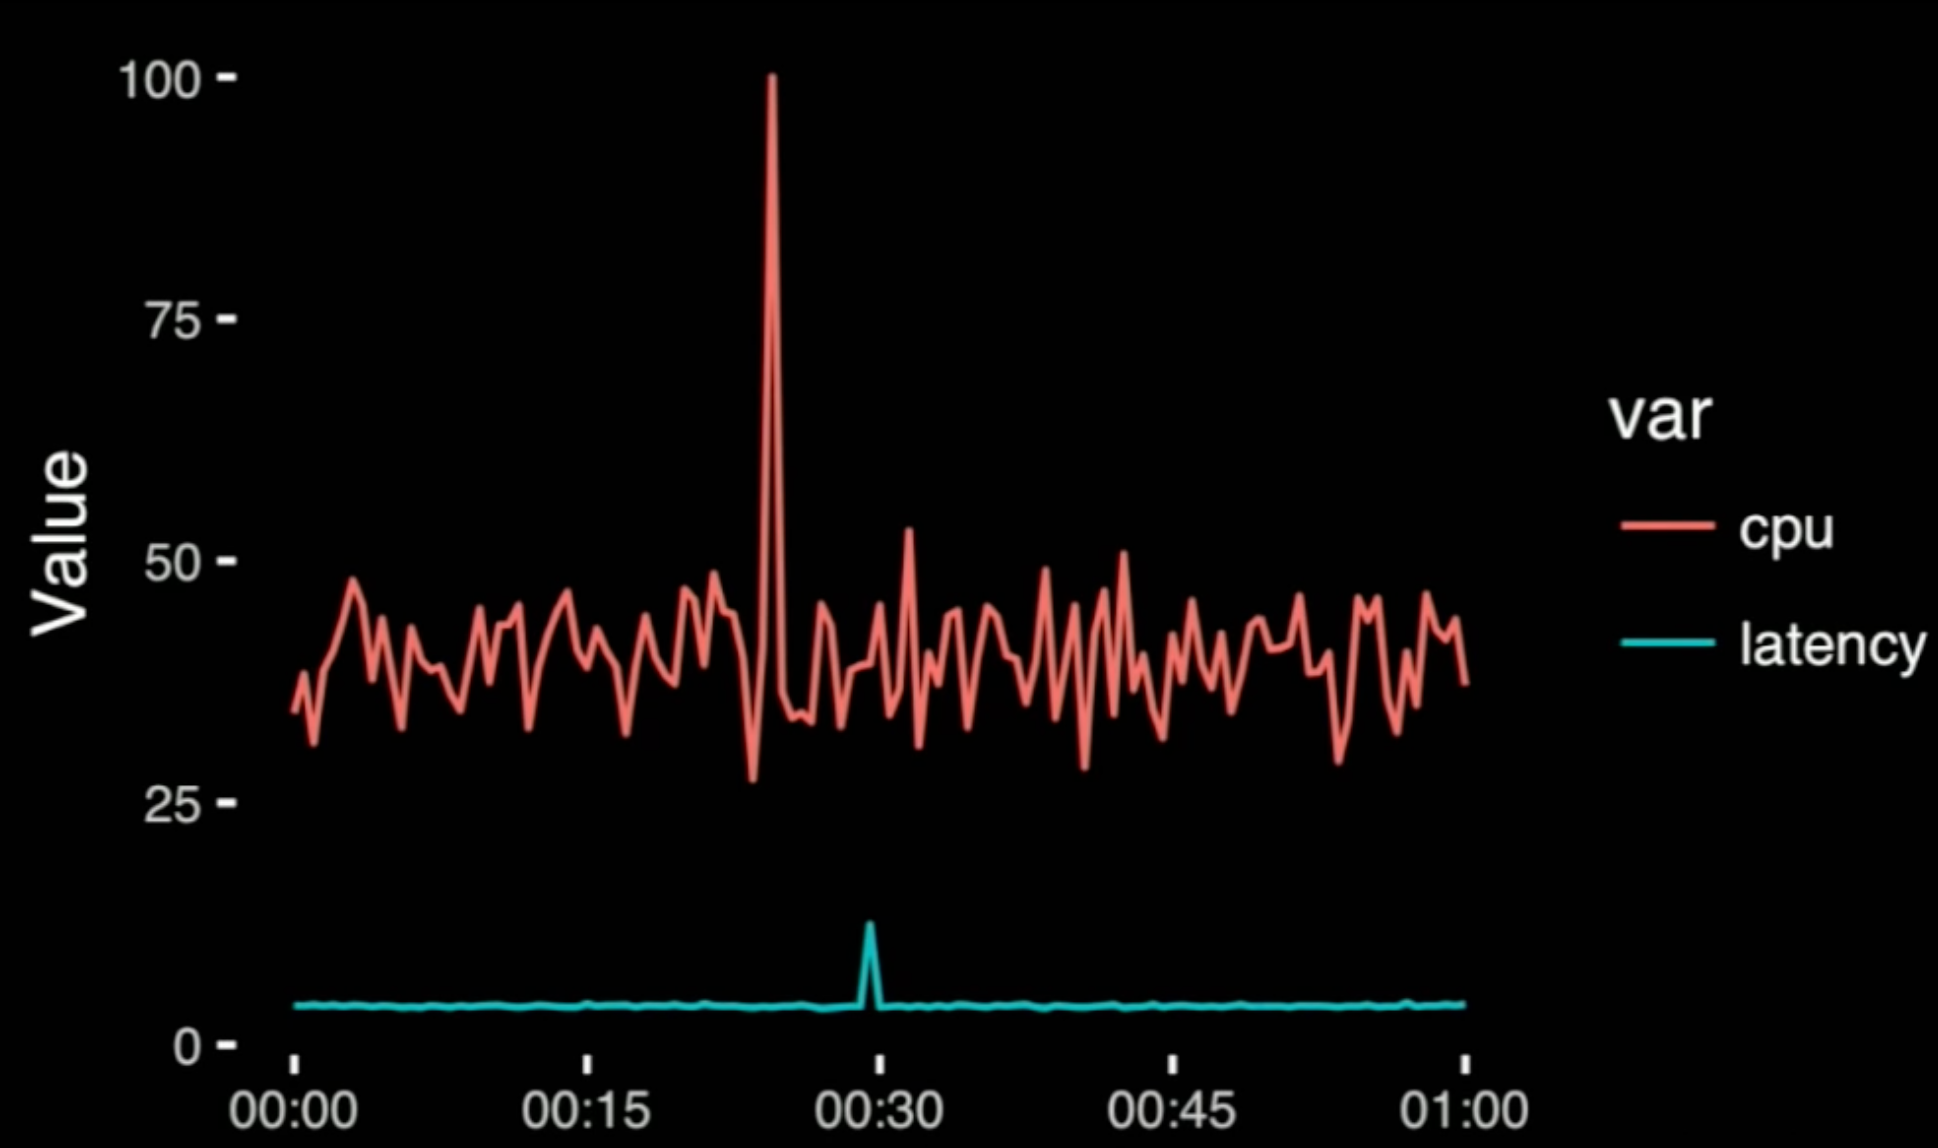
- but now you see why people usually don't do this: the magnitude is v different.
- There's an easy fix:
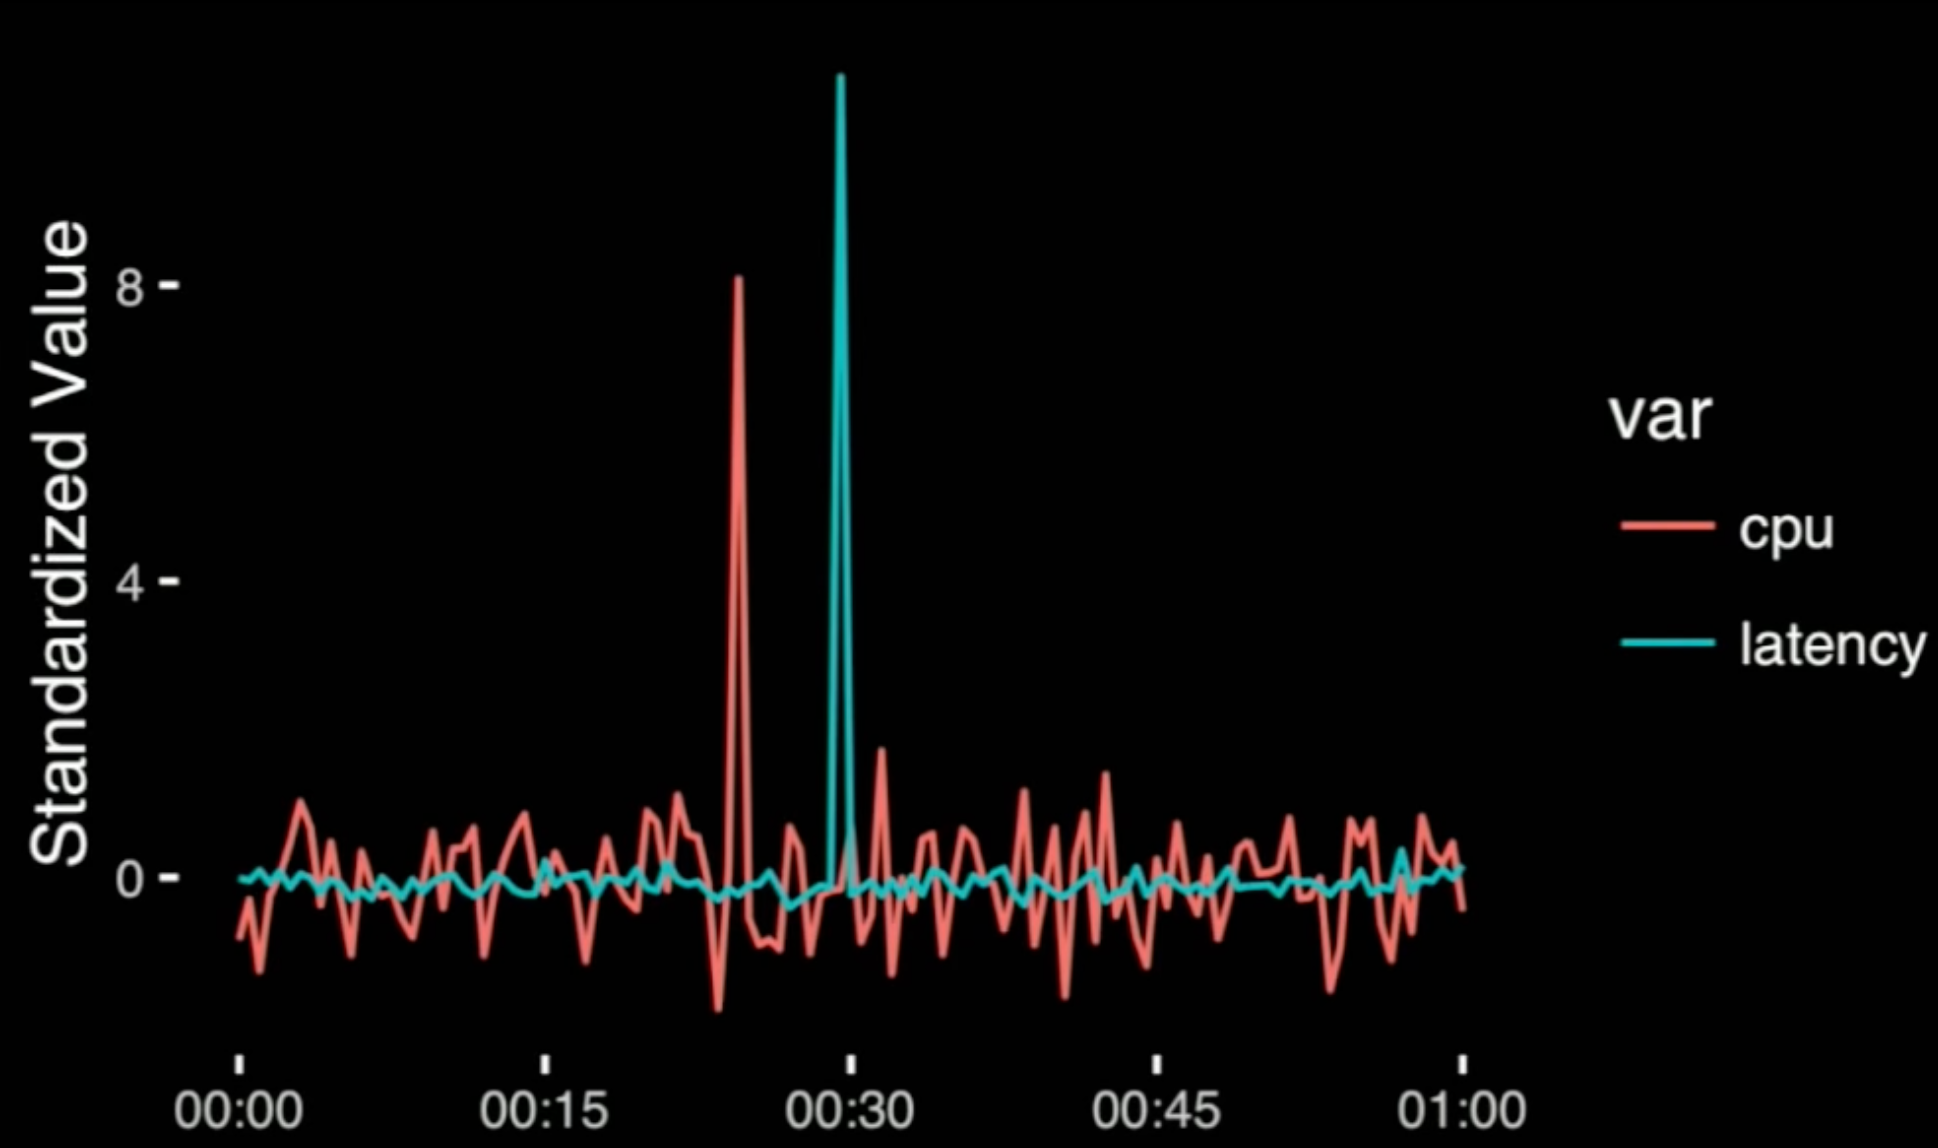
- standardize each series by subtracting its mean and dividing by it's std deviation
- it's true that we have lost some information: we have lost the absolute value of the spikes
- therefore, sometimes you want the first graph, and other times the last
- software should make it easy to switch back and forth
- it's true that we have lost some information: we have lost the absolute value of the spikes
- standardize each series by subtracting its mean and dividing by it's std deviation
- The dashboard metaphor is fundamentally flawed
- The set of values that you want to see is so wide and varied that there cannot be a static set of metrics that successfully encodes them
- The affordances for transforming, rearranging, and replotting data are all complex, clunky and slow
- I think there's a big opportunity to fix it
- if you want to show how two metrics move, there is no better tool than a scatterplot
- gives an example of taking two time series charts, removing time as a variable, and plotting them together as a scatterplot; which demonstrates that the service's latency is bottlenecked on the dependency
- "I don't know of software that makes it easy to make comparisons like this"
- gives an example of taking two time series charts, removing time as a variable, and plotting them together as a scatterplot; which demonstrates that the service's latency is bottlenecked on the dependency
- growth charts usually aren't
- if you care about growth, plot the derivative
- Assembly
- picking up groups from a chart
- humans powerfully pull groups and meaning from visual data
- we strongly prefer to see groups in data
- Detection
- recognizing that a geometric object represents a value
- ex look at a scatterplot, and see that the dot means the x value on the x axis and the y value on the y axis
- not as trivial as it might seem
- recognizing that a geometric object represents a value
- A few more useful results
- Weber's law: the "Just Noticeable Difference" is proportional to the size of the initial stimuli
- ex: telling 10 from 20 is much easier than telling 100 from 110 despite the difference being the same
- This is why grid lines are useful!
- You are best at detecting variations in slope when you are near 45*
- banking to 45: set the aspect ratio of your plots so that the angle of the dominant lines is close to 45
- Should I include 0 on my scale?
- shows a graph where the value is very high, and demonstrates that if you stretch the y axis to zero, you lose the ability to distinguish differences between the points
- Q: Should I include 0 on my scale?
- A: Relying on the pre-attentive perception of size or intensity? Yes, otherwise you will mislead
- A: Using position? It's up to you.
- Gives an example of a dot plot
- "in fact (in this case) it's a good idea to do so because it gives you more resolution"
- in a bar chart, an axis has to start at zero
- because people will compare the size of the bars
- not the case with a scatterplot
- Weber's law: the "Just Noticeable Difference" is proportional to the size of the initial stimuli