A Mandelbrot viewer
I realized the other day that I had never drawn a mandelbrot fractal before, and that seemed like something I ought to have done, so today I wrote a little mandelbrot viewer. Click and drag to zoom in on an area.
The core function
Javascript's lack of support for complex numbers means you have to do a tiny bit of legwork before you can write the core mandelbrot loop.
Here's how I defined simple, inefficient complex number addition and multiplication:
const cmul = (c1, c2) => {
  let [a, b] = c1;
  let [c, d] = c2;
  return [a * c - b * d, a * d + b * c];
};

const cadd = (c1, c2) => {
  return [c1[0] + c2[0], c1[1] + c2[1]];
};
The $mandelbrot$ function accepts a complex number $c$, sets $z = c$ and runs the recursion $z = z^2 + c$ in a loop, incrementing a counter $count$ as it goes.
- If $|z| > 2$, the loop returns $count$
- If $count$ goes greater than some maximum value, the loop returns and $c$ is not considered part of the mandelbrot set
Here's a javascript implementation, where complex numbers are represented as a two-element array:
export const mandelbrot = (c, max_iter) => {
  let z = c;
  let count = 1;
  while (Math.sqrt(z[0] * z[0] + z[1] * z[1]) <= 2 && count < max_iter) {
    z = cadd(cmul(z, z), c);
    count += 1;
  }
  return count;
};
Coloring in the lines
To draw the pretty picture that so many people recognize:
- For every pixel in the canvas:
- Scale the pixel's x and y values linearly from $-2$ to $2$
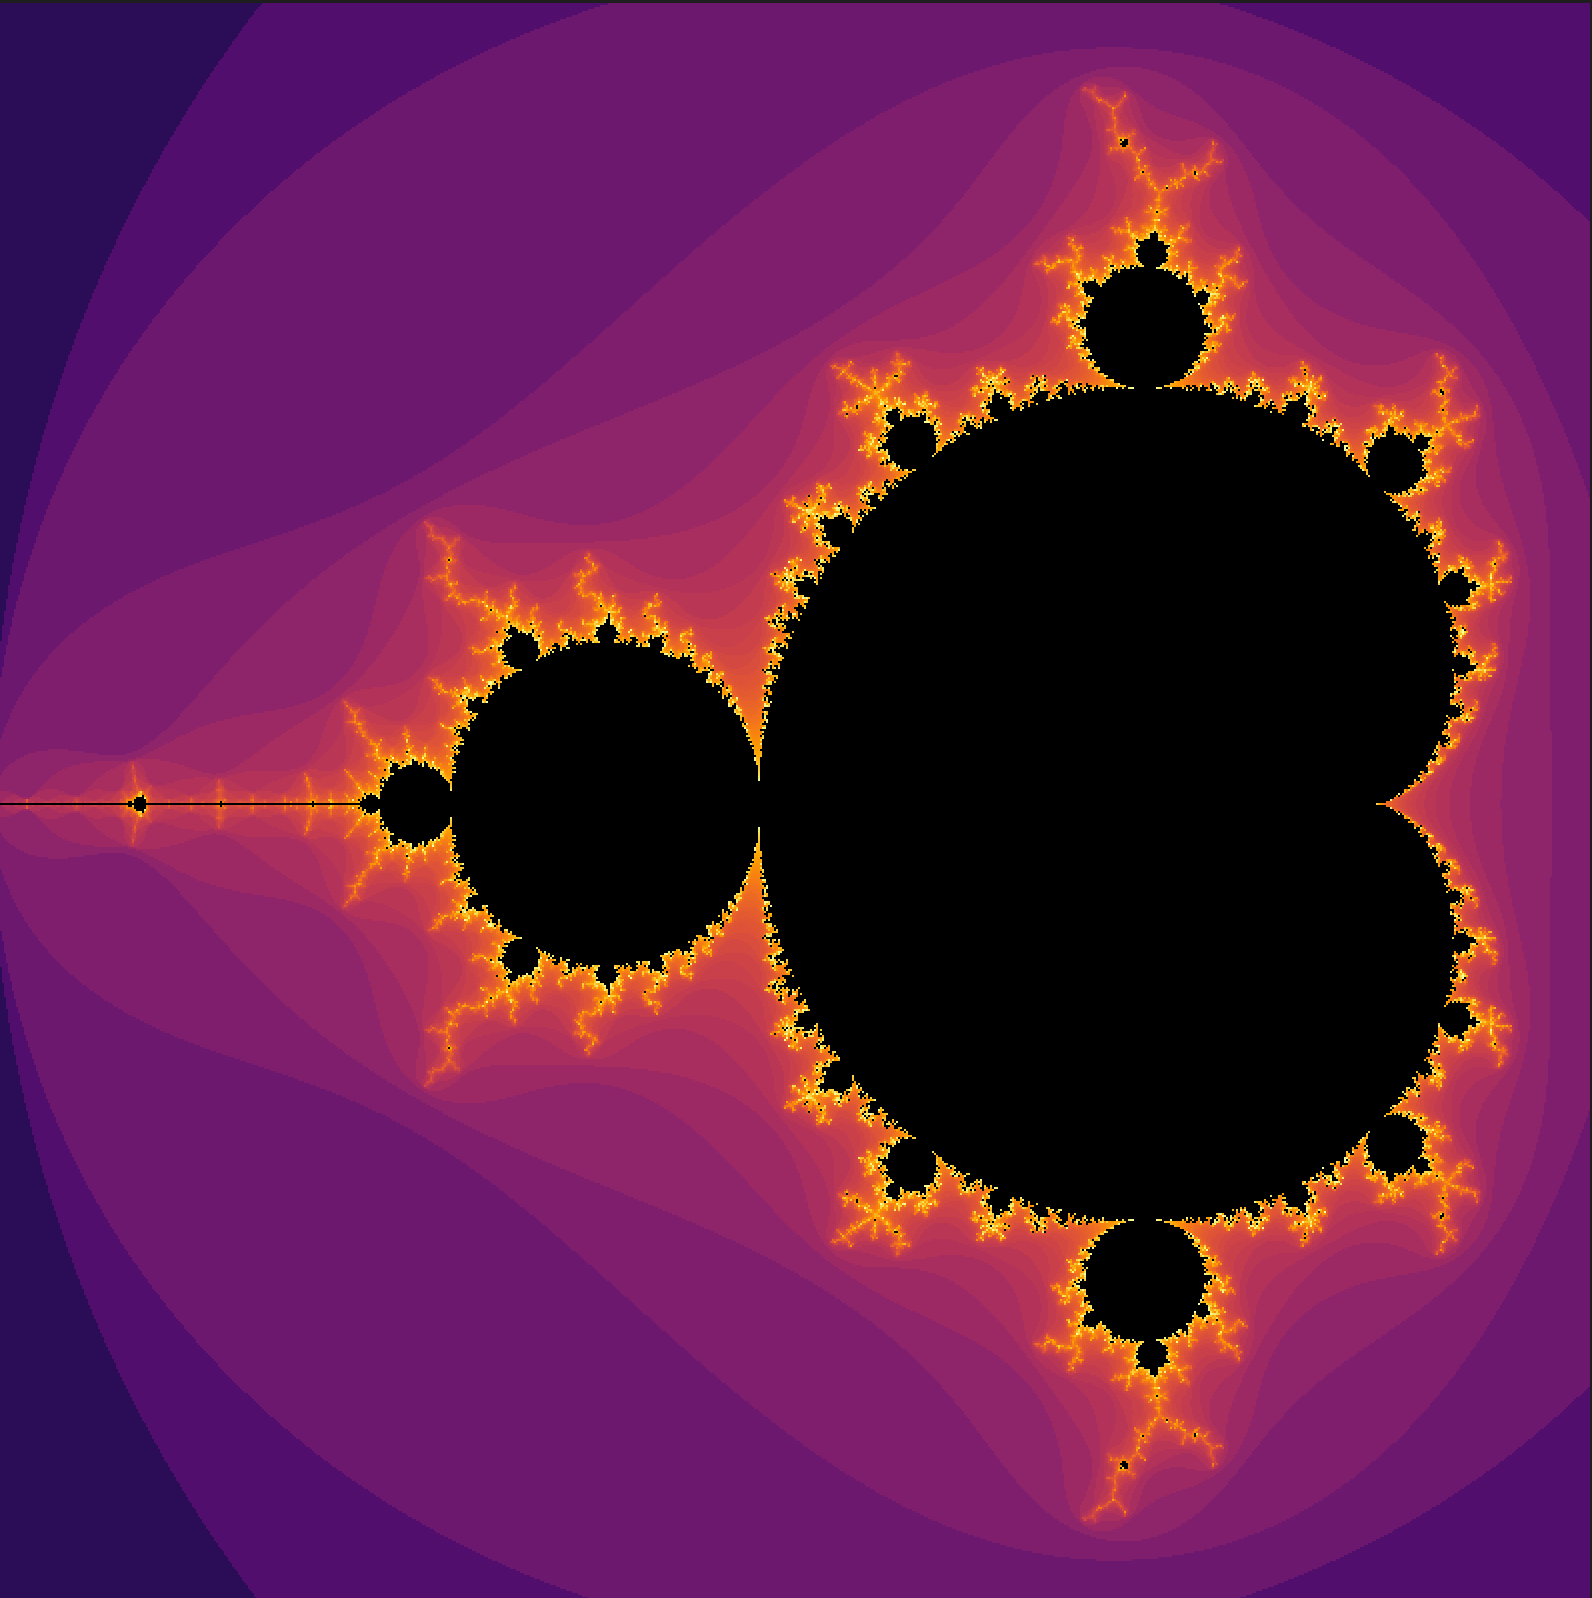
- (or some smaller range... -2 to 2 will give you the whole fractal but I've zoomed in a touch on this image)
- Calculate the $mandelbrot$ value discussed earlier for the complex number with a real part given by the x value and an imaginary part given by the y value
- Try not to be frightened of complex numbers! They're really just a pair of numbers.
- (I was frightened of them for a long time for no reason at all. They have the second-worst name of all mathematical objects, narrowly better than imaginary numbers. I digress)
- Try not to be frightened of complex numbers! They're really just a pair of numbers.
- $mandelbrot$ will return a value between 1 and the maximum number of iterations you chose. Choose a color scale for the returned values and set the pixel to the value according to the color scale you've chosen.
- Values not in the mandelbrot set are usually colored black
- Above I've used a color scheme that is purple on the low end, yellow on the high end, and I've log-scaled the mandelbrot values
- Scale the pixel's x and y values linearly from $-2$ to $2$
Here's a javascript function to draw a mandelbrot on a canvas. It makes use of a few d3.js functions:
import { mandelbrot } from "./components/mandelbrot.js";

// constants
const MAX_ITER = 100;
const W = 800;
const H = 800;

// zoom in the scales a bit; [-2, 2] for both will give a full view
const xscale = d3.scaleLinear([0, W], [-2, 0.6]);
const yscale = d3.scaleLinear([0, H], [1.25, -1.25]);

// set up a color scale
// https://d3js.org/d3-scale-chromatic/sequential#interpolateInferno
const colorscale = d3
  .scaleSequentialLog(d3.interpolateInferno)
  .domain([1, MAX_ITER]);
const colors = new Map();
for (let i = 1; i < MAX_ITER; i++) {
  colors.set(i, colorscale(i));
}
colors.set(MAX_ITER, `rgb(0, 0, 0)`);

// get a reference to the canvas context, loop through every pixel,
// and draw the color given by mandelbrot on the pixel
const ctx = document.querySelector("canvas#mcanv").getContext("2d");
const drawRow = (ctx, y = 0, rows = 20) => {
  for (let y = 0; y < H; y++) {
    for (let x = 0; x <= W; x++) {
      const l = mandelbrot([xscale(x), yscale(y + i)], MAX_ITER);
      ctx.fillStyle = colors.get(l);
      ctx.fillRect(x, y, 1, 1);
    }
  }
};
Resources
- I used this article by the recently deceased A. K. Dewdney as my starting reference.
- Faster fractals through algebra gave me some easy performance improvements to implement
Go give the toy a try and maybe implement your own Mandelbrot - it's really not too difficult and it's quite fun.